
How to calculate discount rate?
In this article, we will focus on how the practitioners calculate the discount rate. The discount rate represents the compensation that investors require to assume the risk of investing in that asset in hopes of receiving the future cash flow generated from it. For quick details you can refer to Investopedia or Wikipedia.
The most commonly seen discount rate would be the cost of debt (“kd”), cost of equity (“ke”) or weighted average cost of capital (“WACC”).
- kd is the effective interest rate a company pays on its debt.
- ke is the return a company pays to its shareholders in compensating the risk they’ve undertaken
- The WACC is a weighted average of the required return on each class of capital and it broadly comprised of the following elements: kd & ke.
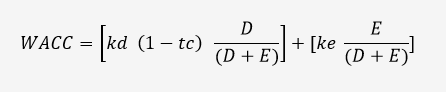
The provider of finance (could be in the form of debt / equity / preferred shares, etc.) for a company will require a rate of return, assuming there is only debt and equity financing, the above WACC formula would be the key to the discount rate. We will come back to this in a bit.
We will walk you through the calculation with an example, say there is a company located in Hong Kong (i.e. FVA Co.) that designs, manufacturers and markets mobile phones and tablets, and computers.
Now we are provided with the free cash flow to firm (“FCFF”) of FVA Co., and are currently at the stage of estimating the discount rate.
How to select comparable company?
Many of you may have thought of calculating the WACC using FVA Co.’s data via subscribed data platform say Capital IQ (“CIQ”) / Bloomberg (“BBG”). The more common approach is to make reference to comparable companies of FVA Co. (in this case, it would be Apple and Samsung and Lenovo, etc.)
Here is the key criteria that one would consider in screening the comparable companies:
- Industry classifications – technology hardware
- Geographic locations – worldwide
- Business descriptions – mobile phone, tablets, computers, etc.
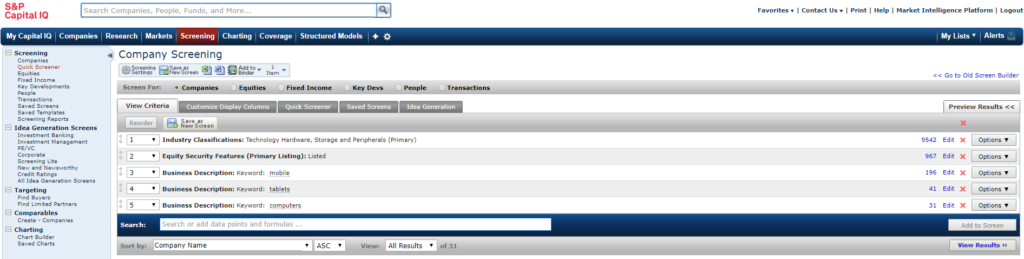
An output of 31 comparable companies – we could do further screening with criteria such as market cap, EBITDA and a lot more.
Common inquiries:
- Suitable size of comparable companies – There is no absolute answer for that, include as much as you can if you see them fit but not recommend to spend too much time and resources on the number (quality matters). A range of from 4 to 8 would be fine in my opinion, depending on how easy you identify the comparable.
- A company with multiple business line such that there is not one single company in the universe that entirely match our company – We recommend you to go look for the revenue/ profit / NAV split of these business lines and select the comparable companies in that proportion.
- Company with new concept and that there is virtually zero existence of related company – It was personal experience years ago, a company that engages in providing trading and consulting services related to carbon assets in China. It was a total disaster in locating the comparable companies at first. We ended up selecting companies that engage in trading / consulting (separately) and these companies have no business with carbon assets at all.
How to calculate cost of equity?
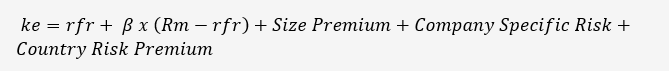
Capital asset pricing model (“CAPM”) is the most common method in deriving the ke.

The basic principle is that investors require a return in excess of risk-free rate to compensate them for taking systematic risk – they should not require a premium for taking unsystematic risk, which can be diversified away.
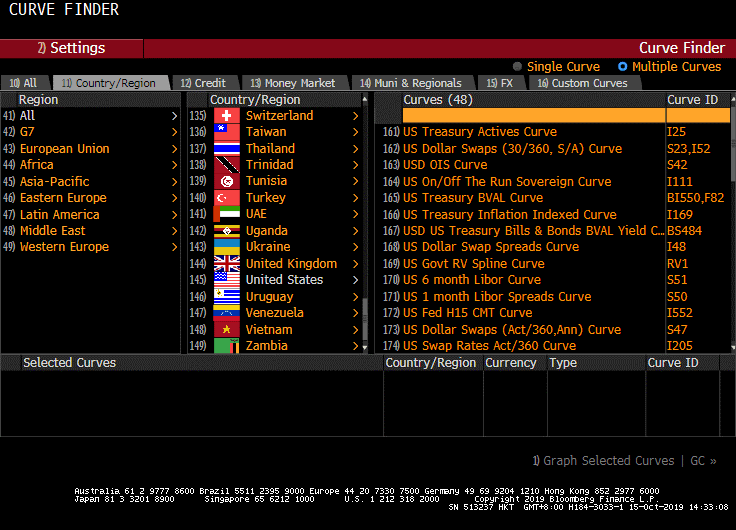
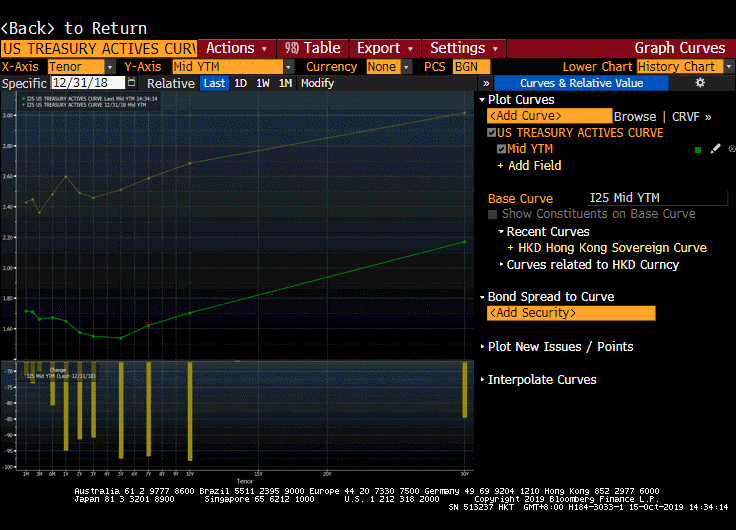
Risk-free rate (“rfr”) could be the US Treasury Bonds or the UK Government Gilts – it really depends on which country the comparable company is located (Say Apple, go for US Treasury)
Tenor could be from 1 year to 30 years – it depends on the length of our financial projection. If the terminal value is considered, go for the maximum (i.e. 30 years).
Bloomberg (“BBG”) function – CRVF
Beta coefficient is a measure of systematic risk that considers volatility of the share price to that of the market. A beta of 1.3 indicates the asset is 30% riskier than the market.
BBG function – BETA
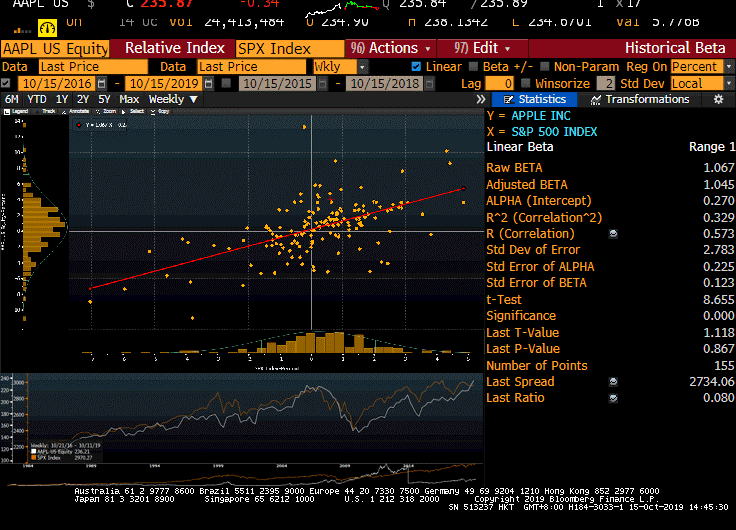
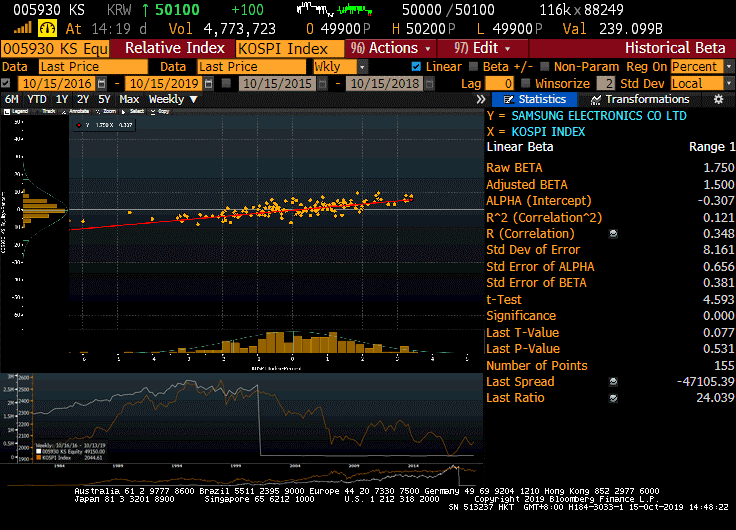
We normally use 3Y weekly data / 5Y monthly data (just to make sure there are sufficient data point for the t-test) and select the adjusted beta. Do consider the R-square and significance of the t-test result when you decide to use the said beta.
The beta we obtained above is the levered beta, we will have to unlever it and then relever it. (The reason is that we would like to get rid of the effect of financial leverage on volatility of return of a single company)
Step 1: unlever the levered beta
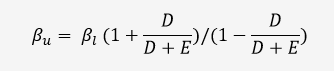
Step 2: relever the unlevered beta
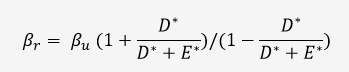
Note 1: (D* / D* + E*), represents the optimal debt-to-capital ratio (to be covered below)
Market risk premium (i.e. Rm – rfr, “MRP”) is the return required over the risk-free rate to invest in the equity market.
To deduct risk-free rate from market return (i.e. return of a market index) is one way of doing it but this would require a large volume of data, and that the selected period of data might not be meaningful (imagine a downward trending market for the past 5 years would likely yield a very low MRP, or even negative.)
As such, the
practitioners often make reference to Professor Aswath Damodaran’s equity risk
premiums by country.
Link: http://people.stern.nyu.edu/adamodar/pc/datasets/ctryprem.xls
More about the Professor: http://pages.stern.nyu.edu/~adamodar/
There is no rocket science – the equity risk premium for the United States (Apple is listed in the US) is 5.96% (last updated January 2019).
This is important – so far we have been locating the inputs for the comparable companies (i.e. Apple and Samsung) but not the subject company (i.e. FVA Co.)
Although we have mentioned that CAPM is the preferred model, we recommend the use of build-up model in estimating the cost of equity as it incorporates unsystematic risks such as the company specific risk and size premium.
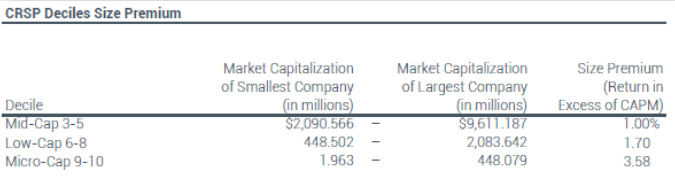
Size premium is the historical tendency for stocks with smaller-market-cap to outperform the one with larger-market-cap.
The practitioners often make use of the table – CRSP Deciles Size Premium, published by Duffs & Phelps. The size premium is selected according to the market cap of the FVA Co. (remember we have got the FCFF and thus the enterprise value, all we have to do is to convert it to equity value), say if the equity value of FVA Co. is around USD 500.0 million, then you may add 1.70% on top of the ke calculated using the CAPM.
Company specific risk, is really case dependent, arbitrary and subjective.
The rule of thumb is that the higher the risk associated with the financial projections, the more company specific risk you add. Triggering points could be lack of product diversification, concentrated customers, reliance on single product, budget miss, deteriorating financial performance and change of key management, etc. Say we consider 2% of company specific risk for FVA Co.
Country risk premium is used to adjust the differences between the comparable companies’ MRP and the target’s MRP.
How to calculate cost of debt?
We have to consider the (hypothetical) market rate of interest the subject company (i.e. FVA Co.) has to pay for its debt.
If FVA Co. is a listed company, we could refer to the annual report for the effective interest rate they are borrowing at. However, there are two things, first, we shall not refer to secured borrowing (i.e. with collateral pledged with the borrower), and second, the referenced borrowing shall share a similar maturity with the period of the financial projection.
Simply put, if they are unsecured borrowing and the maturity is relatively long (i.e. 10 years) then we would say that this is a good referenced kd.
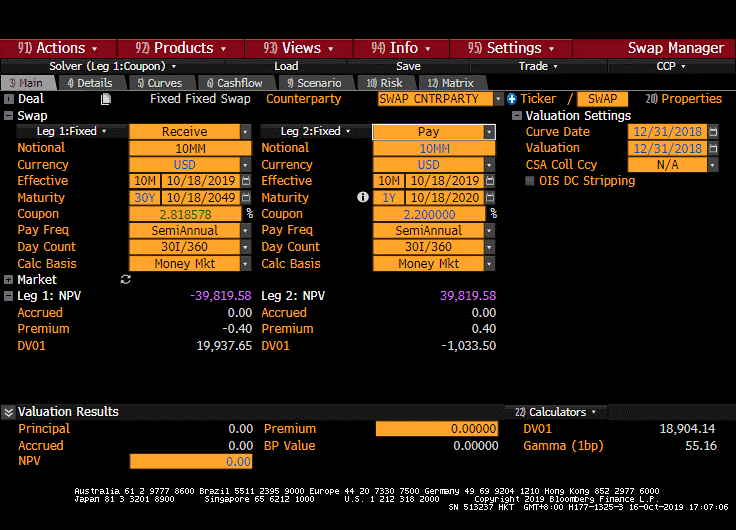
It is common for companies to borrow very short-term and thus a longer maturity borrowing might not exist. In this case, we could deploy certain tools in BBG (“SWPM”) with an attempt to extend the borrowing period in attaining certain hypothetical rate as if the loans were borrowed at a relatively long-term.
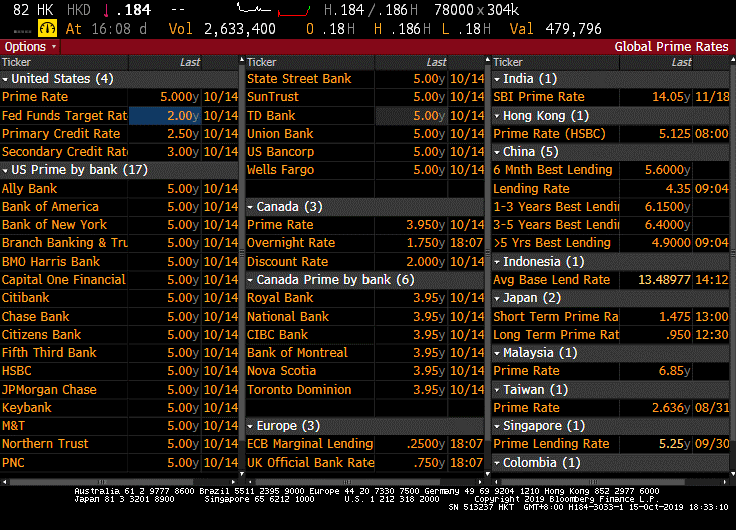
Say, if FVA Co. is a private company (as in our case), obviously we could not obtain the kd from public source (but that does not mean you cannot ask management of the subject company, if they are willing to share with you the cost of borrowing). We could make reference to the prime rate (“PRIM”), an interest rate at which banks lend to favoured customers.
BBG – SWPM / PRIM
Though you may argue that the target company may not be favoured by the banks (as in they might not be as creditworthy and therefore not eligible to the prime rate), in that case, we might have to do some proper credit rating analysis in arriving a rating for the company and therefore the corresponding yield (kd) for a certain time period of borrowing (there will be a long chapter in credit rating analysis and we would cover it later).
Overall, if the target is highly geared, then they should have the reference borrowing rate (so that you can work on the rate as we mentioned above). Otherwise, the cost of debt might not be as significant to the overall discount rate as the WACC would tilt toward the cost of equity. In this sense, it might not be unreasonable to simply go for the prime rate as it will not impact the WACC much.
One final word on cost of debt, if the company is new and relatively risky (i.e. say a cost of equity of around 20% or above), it might not be reasonable to simply use the prime rate. Imagine you are the corporate banker, would you be willing to lend these start-up a hand at say 5% (without any collateral)?
WACC
Now we come back to the WACC formula, the remaining items would be the corporate tax rate, and the capital structure.
Corporate tax rate should be considered as you saved tax by paying interest. This is one of the reasons why, in general, the higher the cost of debt (after-tax) the lower the WACC (but then too much gearing would introduce bankruptcy cost and may eventually increase the WACC).
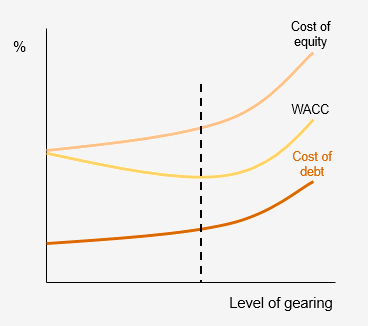
Premise to the above, the weight of debt and equity would impact the WACC, i.e. initially with higher debt could help to lower the WACC (up to an optimal point), but too high would ultimately shoot up the WACC.
In practice, we come up with an optimal capital structure / optimal debt-to-capital ratio based on the historical comparable companies’ capital structure (here we mean the D / D + E, say 3 years, we can take average or median – they could be found in the annual report or better yet, one click away from the data providers if you have subscribed for their services)
For debt (D) we actually means the net debt (i.e. we deduct total cash and short-terms investments from the total debt); as for equity (E), it is the last closed market cap (remember this is not the equity value from book) (If there is total preferred equity, treat it as part of the equity)
The frequency (annual / semi-annual) would depend on whether you are considering the annual report as well as the interim report. Obviously, the higher frequency (i.e. semi-annual) would provide better insight as you could expect less spikes (changes) in the ratios between periods.
Final words
Want a live example of how to calculate the WACC having followed the above procedures step-by-step? Let’s watch the video.